

Welcome to The Hook — Monday Edition.
Every Monday, we take a boring dataset and turn it into a story. Plus, 2 quick data storytelling tips to use at work this week.
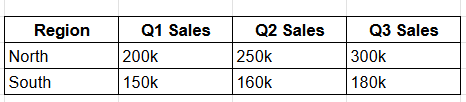
Before & After: Turning Tables into Stories
Before:
A table of quarterly sales:
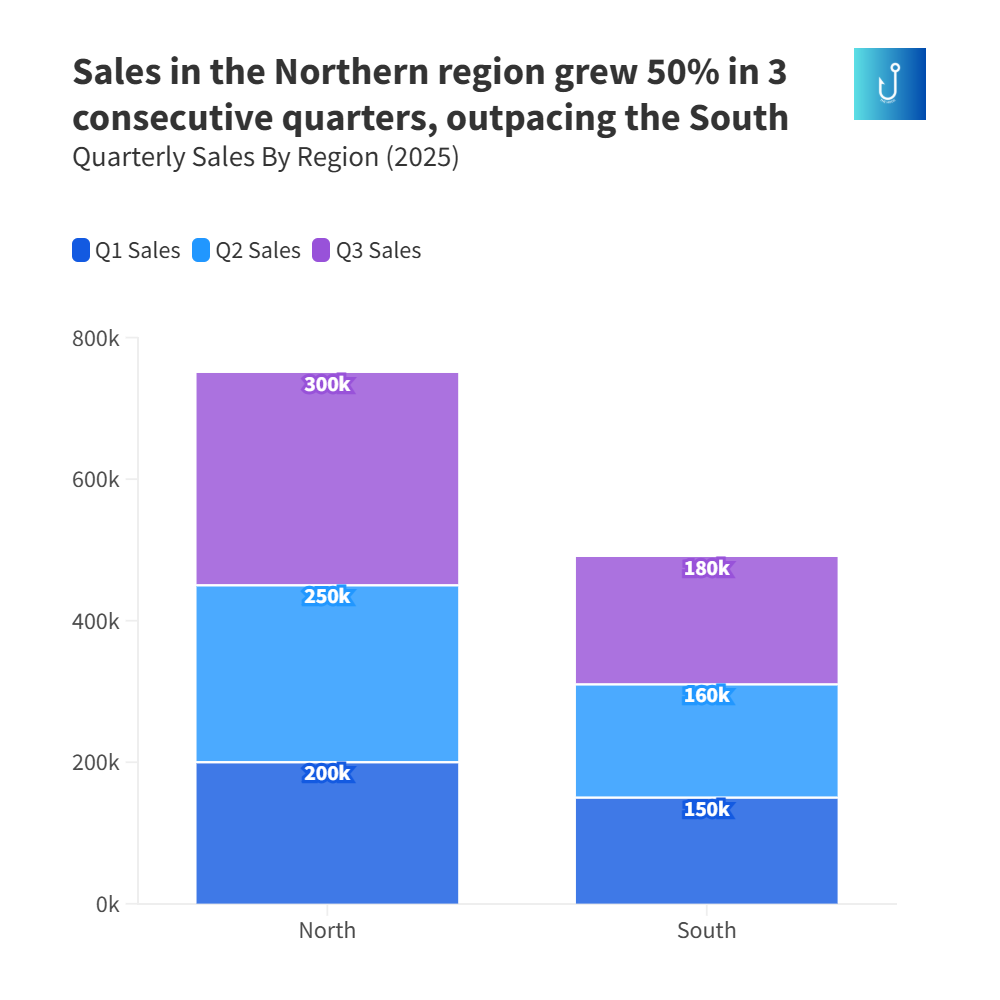
After (story chart):📊
2 Data Story Tips for the Week
Write your chart title as a takeaway.
Pick one message per chart to avoid confusion.
Viz Finds of the Week
💡 Use this hack in your meetings, presentations, and reports this week. Take one raw dataset, highlight the most important difference or change, and make that your headline.
See you on Friday for a deep dive into culture, sports, and the economy through data.
Want your team to tell better stories? Send an email to mobolajiadeb@gmail.com to book a data storytelling workshop.
Want to tell better data stories—whether in meetings, content, or reports? Book a 1-on-1 session and learn how to turn numbers into narratives that stick.
Please forward this email to one friend who loves data or good stories.