What does the Olympic Medals Table tell us?
Performance at the Olympic games are driven by a few indices that make a country great: state capacity, economic growth, and investment in human capital. It reveals the divide between rich and poor
Thank you for reading The Hook! This free weekly newsletter explores the data behind specific fields of human endeavour: sports, pop culture, digital economy, and entertainment. It lands in the inbox of 50 subscribers every week! You can support this newsletter by sharing this free post.
Hello Everyone. TGIF.
I have to apologise to all of you.
When I began this newsletter, I was prepared to meet all publication dates. This past week, I couldn’t keep to my promise.
Some personal issues got into the mix and I couldn’t send the newsletter on Sunday at 5 pm as promised.
On to my usual question, How’s the week been for you?
This week has been super interesting. First, the newsletter crossed the 50-subscriber mark. This couldn’t have happened without every one of you. Thank you for sharing.
If you have any feedback or suggestions on improving the newsletter, please share them with me.
Many thanks to Toheeb and Timi for editing the first draft of Today/s newsletter and beating it to shape.
If you missed last week’s newsletter, you can read it here.
Here’s a quick fun fact before you read today’s newsletter
10,500
The approximate number of athletes that competed at the 2024 Olympic Games.
Now to this week’s newsletter:
When the 2024 Olympic games began, I made a post comparing the all-time performance of different countries/ NOC(National Olympic Committees) since the first modern games held in 1896. The United States led the pack among a host of countries including China, Japan, and Germany, Great Britain etc.
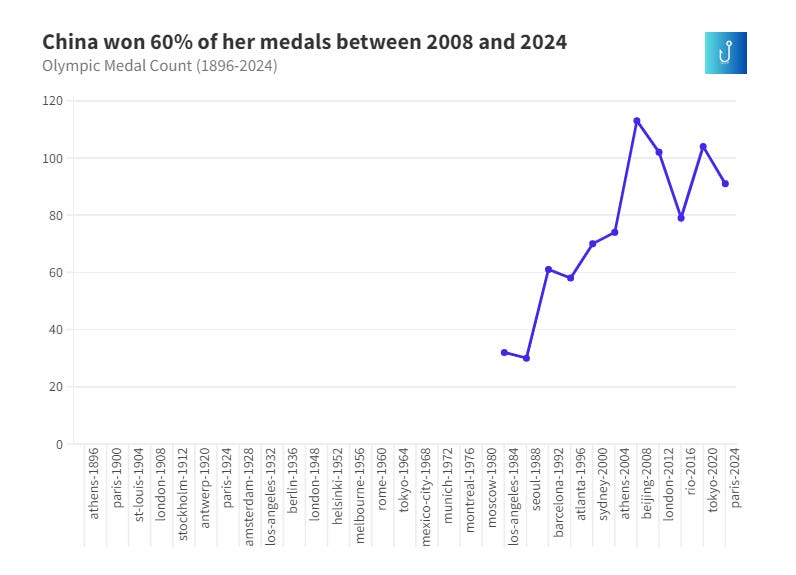
Among these countries, China’s rise to Olympic greatness is an interesting one. A tale of two periods emerges: pre-2008 and post-2008. The chart below tells a story of the different periods.
Between 1980 and 2004, the country consistently improved its Olympic performance but never broke the 80-medal mark. From 2008 to 2024, she surpassed the 100-medal mark thrice in five attempts.
China's remarkable rise in Olympic dominance is no coincidence. It reflects more than just athletic achievement and traces back to 1978, a pivotal year of socio-political change.
In 1978, Deng Xiaoping, the brain behind China’s cultural revolution, became China's paramount leader during the 3rd Plenary Session of the 11th Central Committee in December of that year. In August 1980, Deng embarked on a series of political reforms, which gradually led China away from a command economy and Maoist dogma, opened it up to foreign investments and technology, and introduced its vast labour force to the global market. This process transformed China into one of the world's fastest-growing economies.
Back to 2024
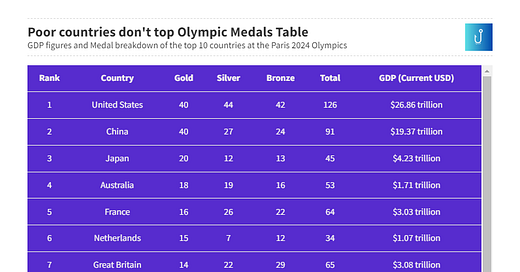
The standings of the just concluded Olympic games reveals one key insight: The top performing countries are trillion-dollar economies.
What about the bottom?
114 countries did not win a single medal at the Olympics. You can see a full list here. These countries have an average GDP size of $50.67 billion
As we wrap up, it's clear that the 2024 Olympics spotlighted more than just athletic prowess—it highlighted the economic might of nations. The top performers were trillion-dollar economies, underscoring the link between resources and global dominance in sports. On the flip side, the 114 countries that didn't take home a single medal had average GDPs around $50.67 billion. It’s a stark reminder of the disparities in global sports, reflecting not just talent but the broader economic and infrastructural divides.
Now to a fun activity
What happens when we compare medal count relative to population size?
This map visualization has all the details.
Find out how your country performed and share it with me in the comments
See you next week and have a great weekend ahead.


